Year
2024, 2025, 2026 (final report in progress)
Discipline
Information design, data visualization, civic design
Role
Civic Data Designer; design direction and final layout
Client
City of Detroit, Data Strategy & Analytics ARPA team (Department of Innovation and Technology), with editorial support from the City's Communications Team
2025 report
2024 report
I handled design direction and final layout for three years of Detroit's ARPA recovery reports, the published 2024 and 2025 editions and the final report, which is in progress, and across all three I turned data from 138 programmed projects into long yet readable documents built on charts, maps and a repeatable data-merge workflow.
Context and challenge
Detroit programmed $826.7 million in American Rescue Plan Act (ARPA-SLFRF) funding across 138 projects, and every year the City has to publish a Recovery Plan Performance Report that explains where that money went and what it did, which means producing a document that satisfies federal reporting rules, speaks to residents and council, and stays accurate across dozens of program areas at once. The 2025 edition runs to 333 printed pages and reports on all 138 of those projects, while the 2024 edition runs to 347 and covers the 127 projects approved at that point, so the real challenge was keeping a consistent and legible system across a very large and constantly changing body of content. The final report in the series is in progress.
My role
I was the Civic Data Designer on the City's Data Strategy & Analytics ARPA team from 2024 to 2025, before becoming a Service Designer, and my part was design direction and final layout, while the team authored the content and the Communications Team provided editorial support. I formatted, laid out and designed the 2024 report, and I led the formatting, layout and design of the 2025 report.
Process
I built the reports in InDesign around a set of data-merge templates, so that project pages could be generated from cleaned project lists and merge CSVs rather than laid out one by one, and I paired that system with a family of charts (household and project network charts, financial stacked bars, down payment assistance charts) and with maps that show where projects are working across the city.
Outcome and impact
The 2024 and 2025 reports are published on the City of Detroit website, and the final report is in progress. By 2025 the reports covered 138 programmed projects, up from 127 approved projects in the 2024 edition, with the 2025 report at 333 printed pages and the 2024 report at 347 (each one also carries an individual profile for most of those projects, 128 in 2025 and 104 in 2024). The entire process, from data to final layout, was completed in under one month for each report. ARPA-SLFRF projects are working in 97.1% of Detroit's 2020 census tracts (268 of 276) and 98.5% of its neighborhoods (202 of 205), and 35 community organizations worked as subrecipients on 26 projects, which are exactly the kinds of figures my maps and charts were built to make visible.
Credits
Authored by the City of Detroit's Data Strategy & Analytics ARPA team; design direction and final layout by me; editorial support from the City's Communications Team; data from the ARPA project teams. Team members are listed on each report's Contributors page.
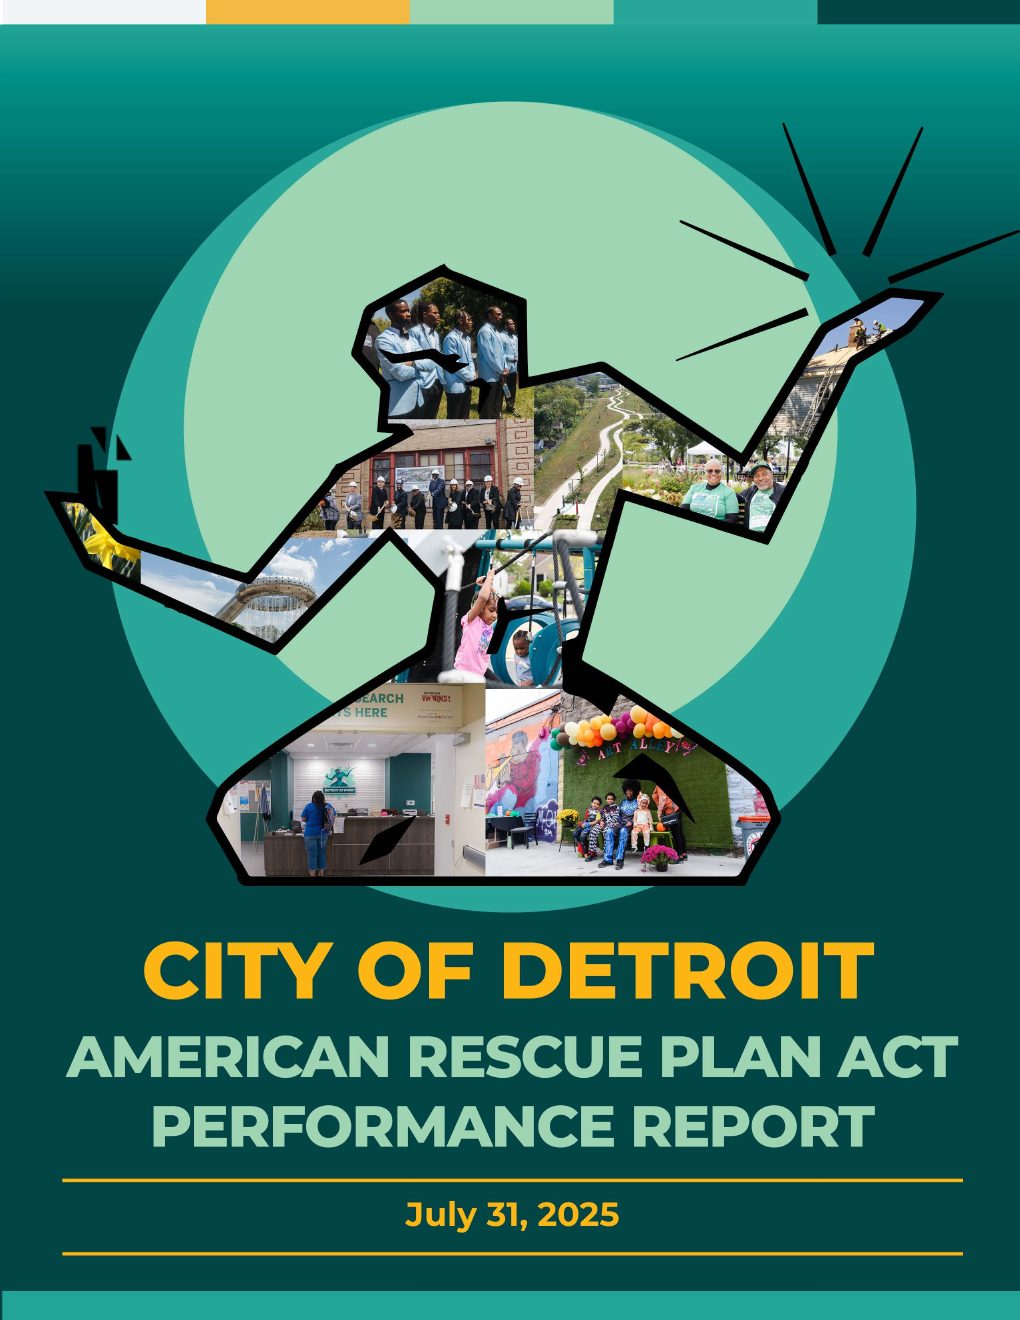
01/12 2025 report, cover.
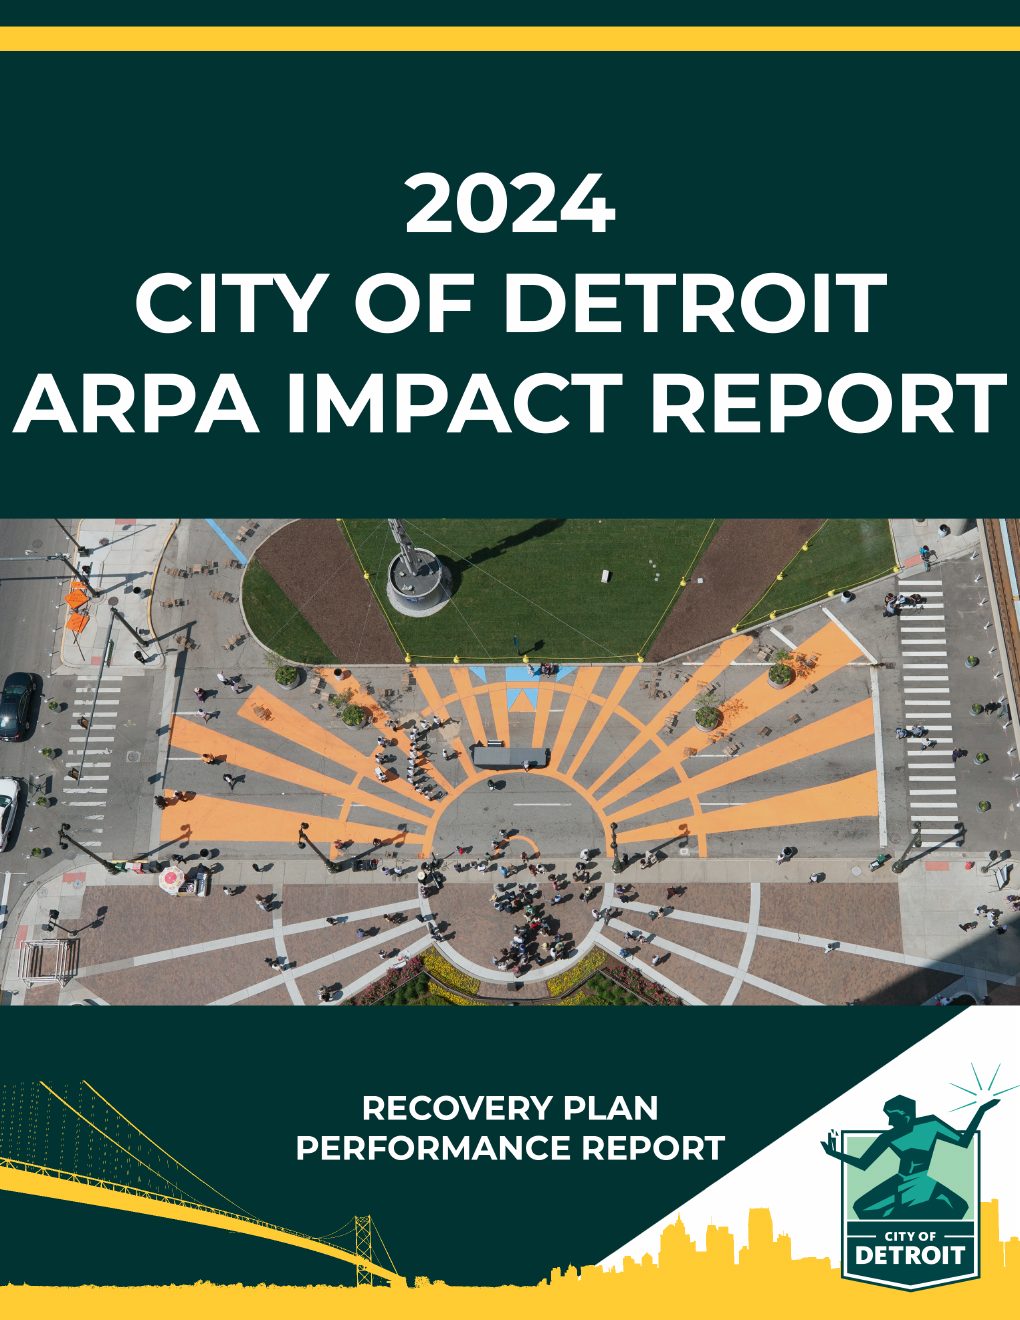
02/12 2024 report, cover.
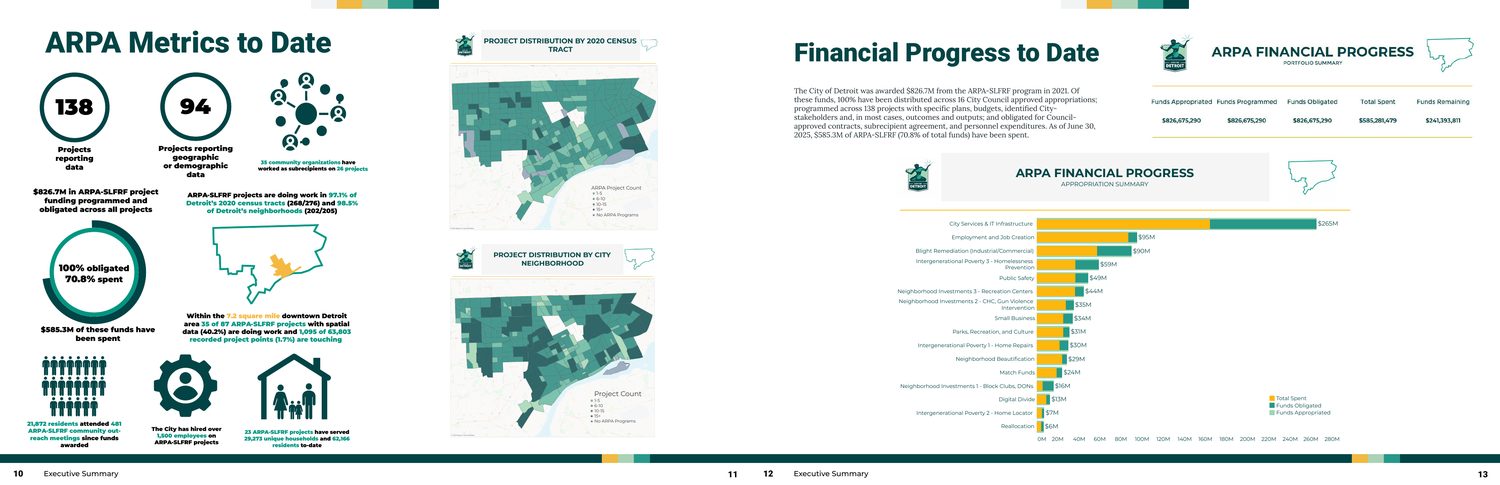
03/12 2025 report, pp. 6 and 7, ARPA metrics and financial progress.
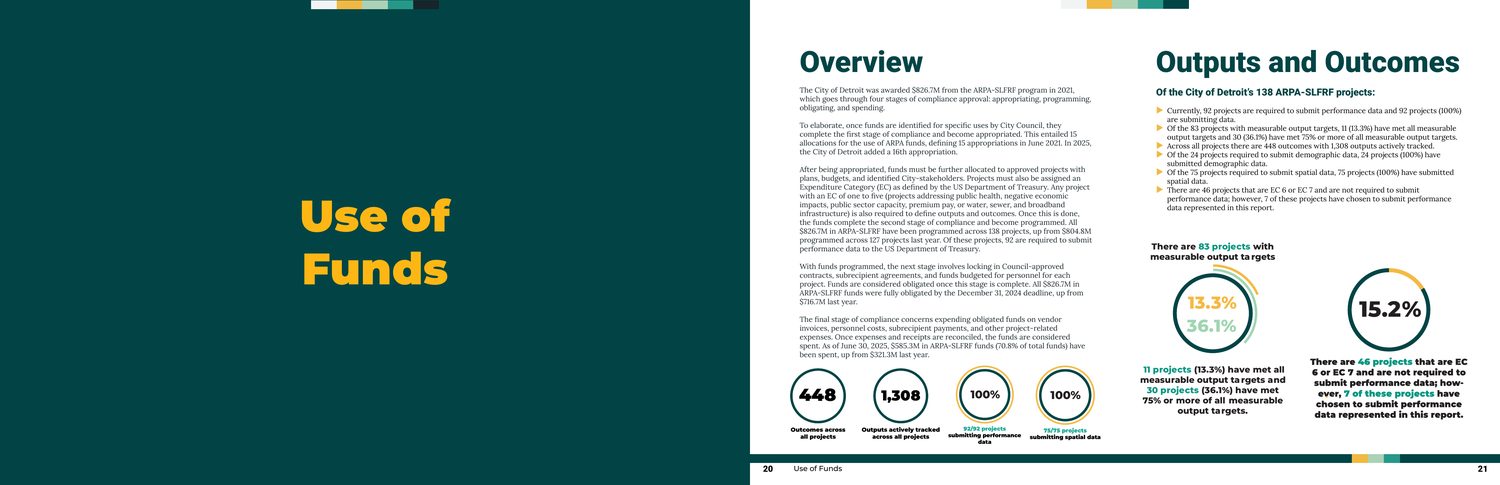
04/12 2025 report, pp. 10 and 11, Use of Funds divider and overview.
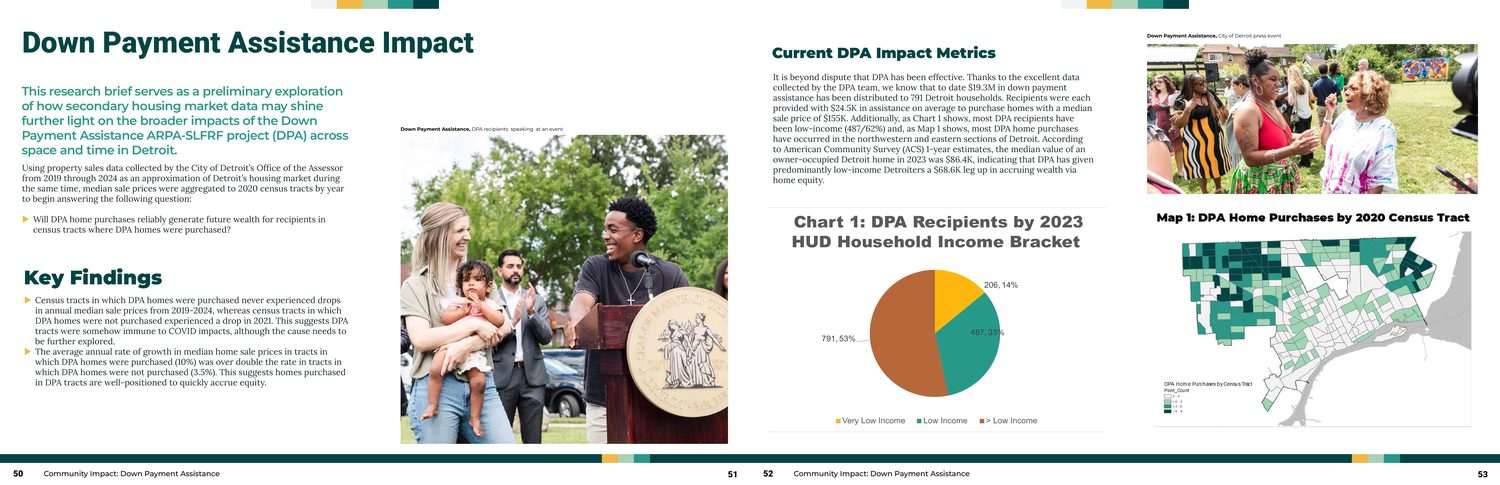
05/12 2025 report, pp. 26 and 27, Down Payment Assistance impact.
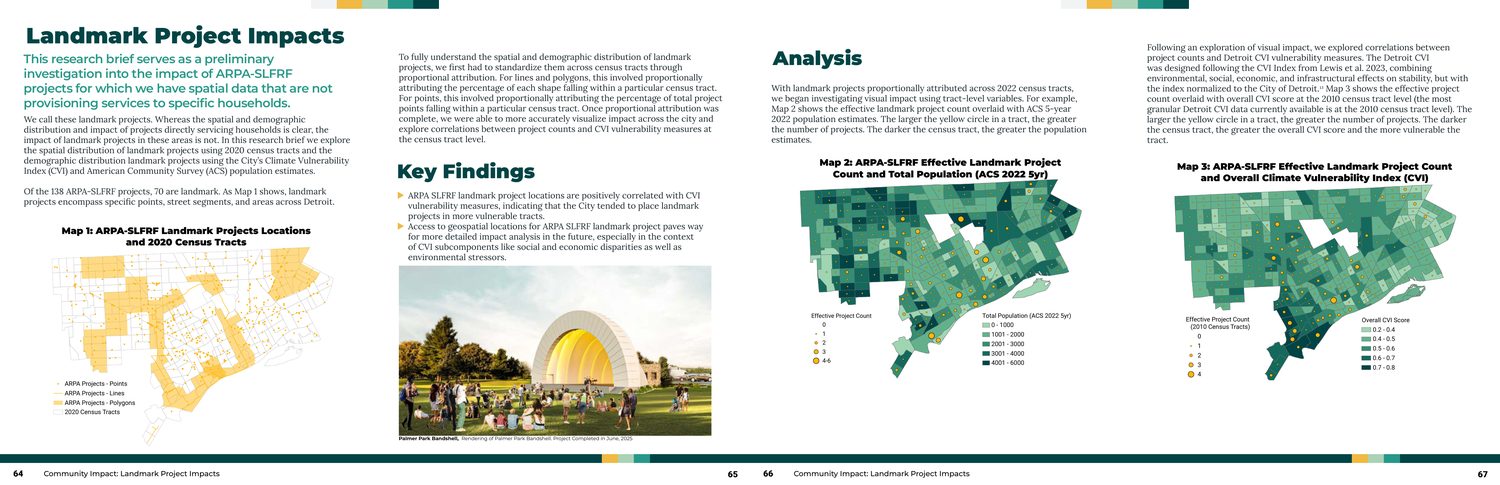
06/12 2025 report, pp. 33 and 34, landmark project maps.
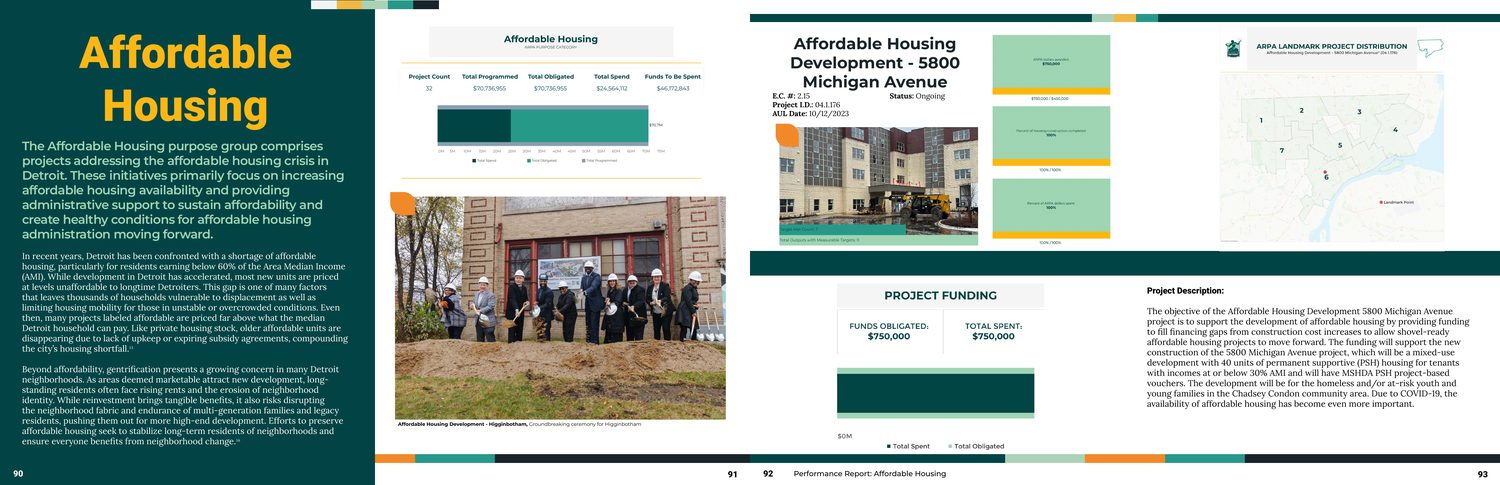
07/12 2025 report, pp. 46 and 47, Affordable Housing divider and project profile.
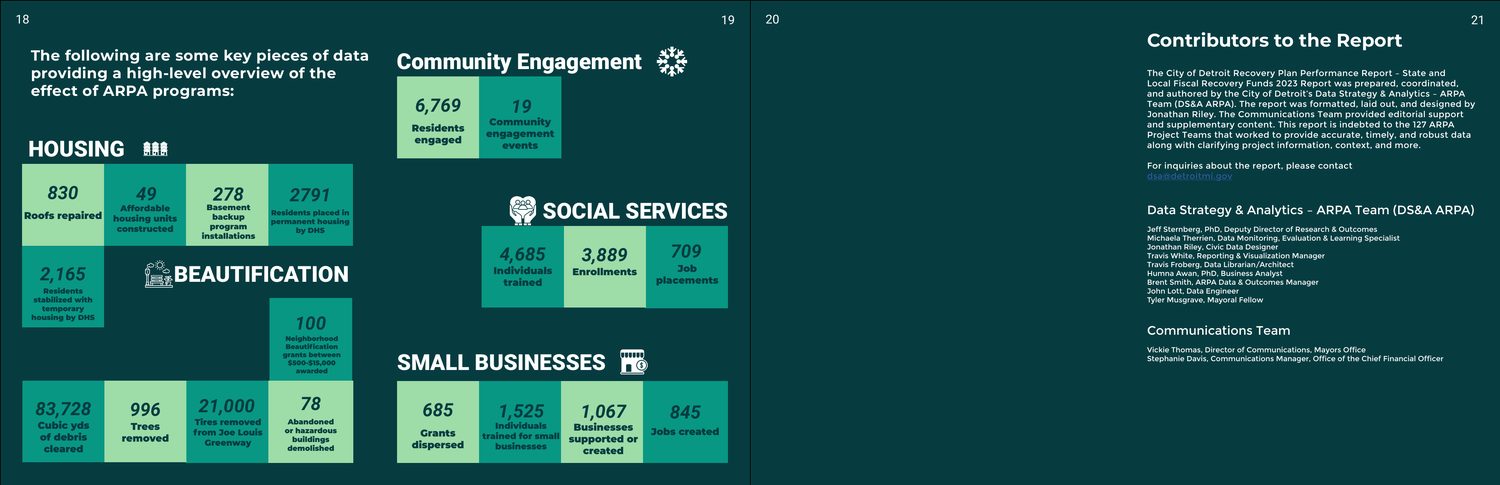
08/12 2024 report, pp. 10 and 11, impact metrics dashboard.
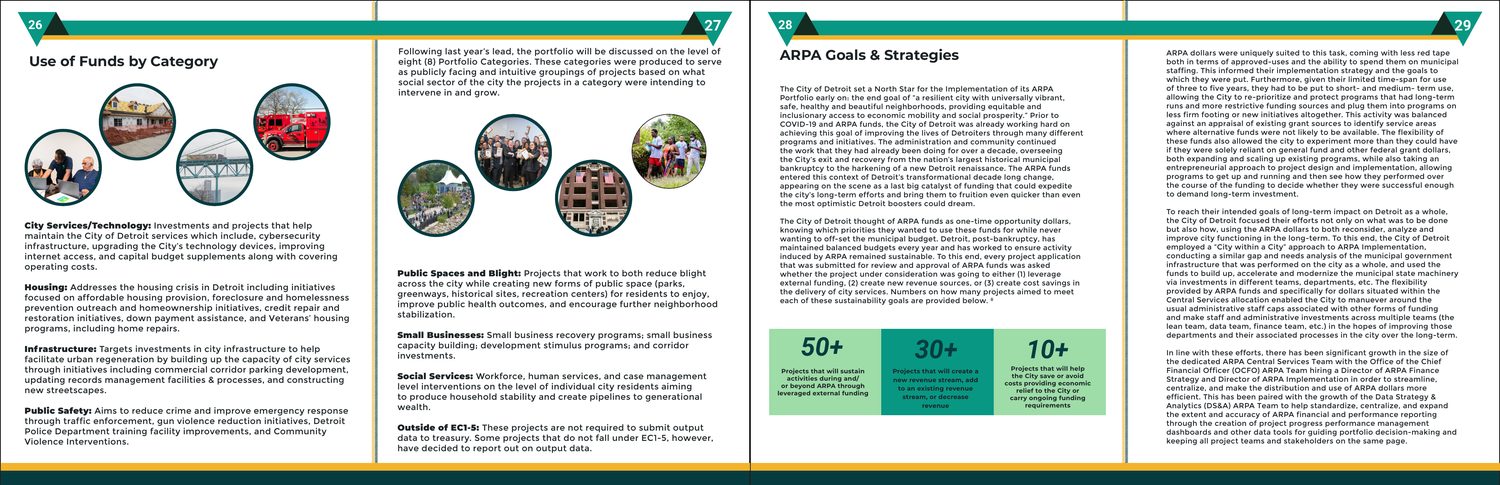
09/12 2024 report, pp. 14 and 15, projects by category.
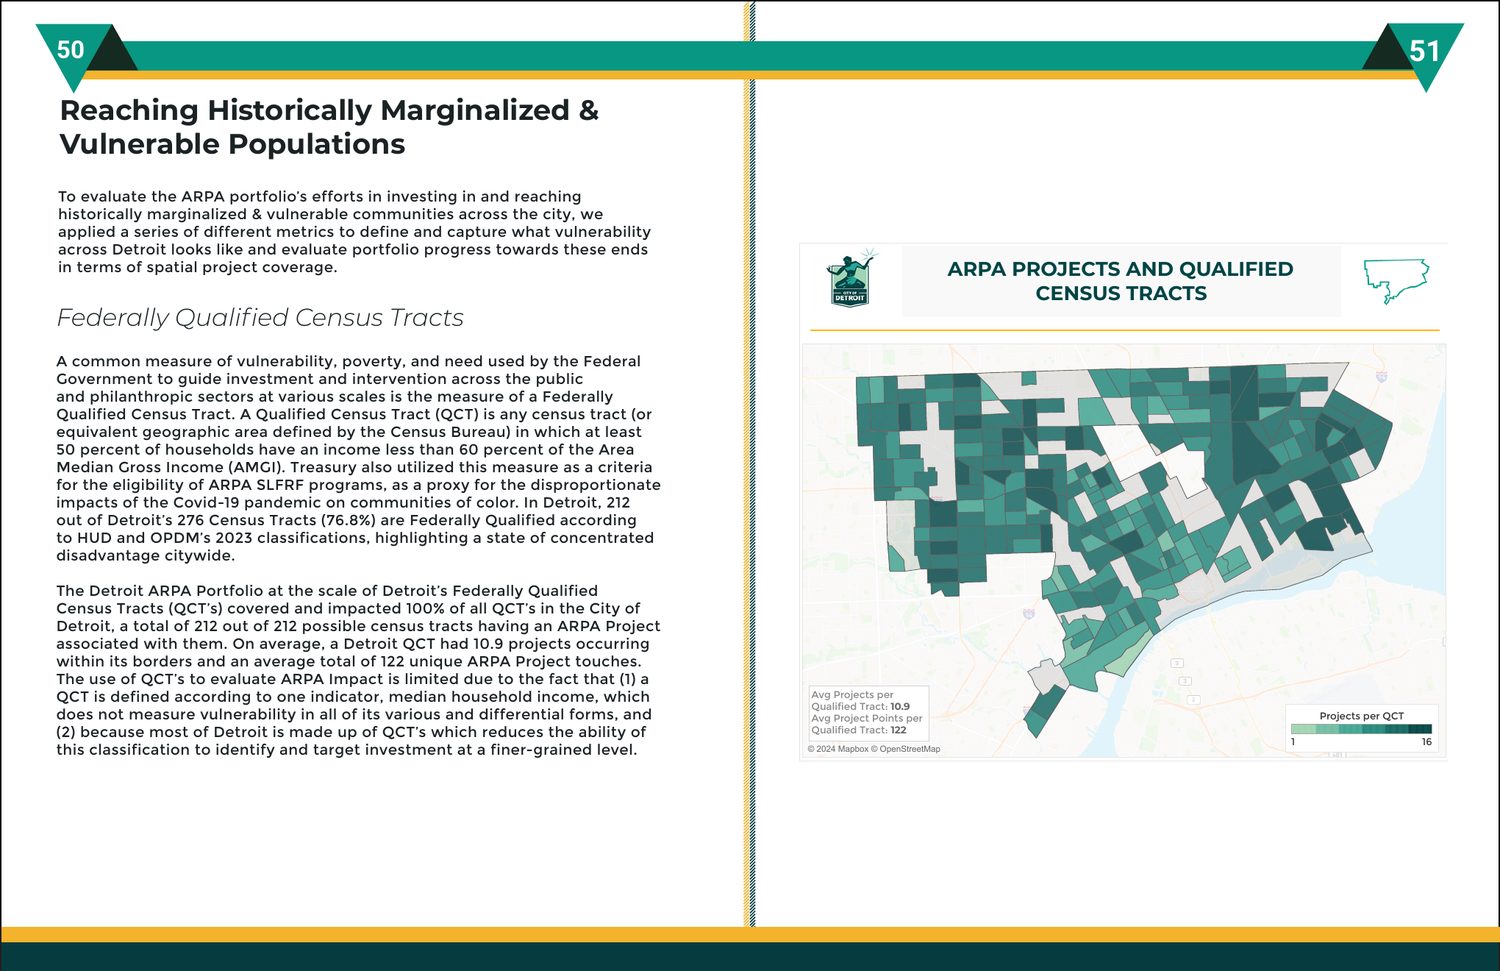
10/12 2024 report, p. 26, qualified census tracts map.
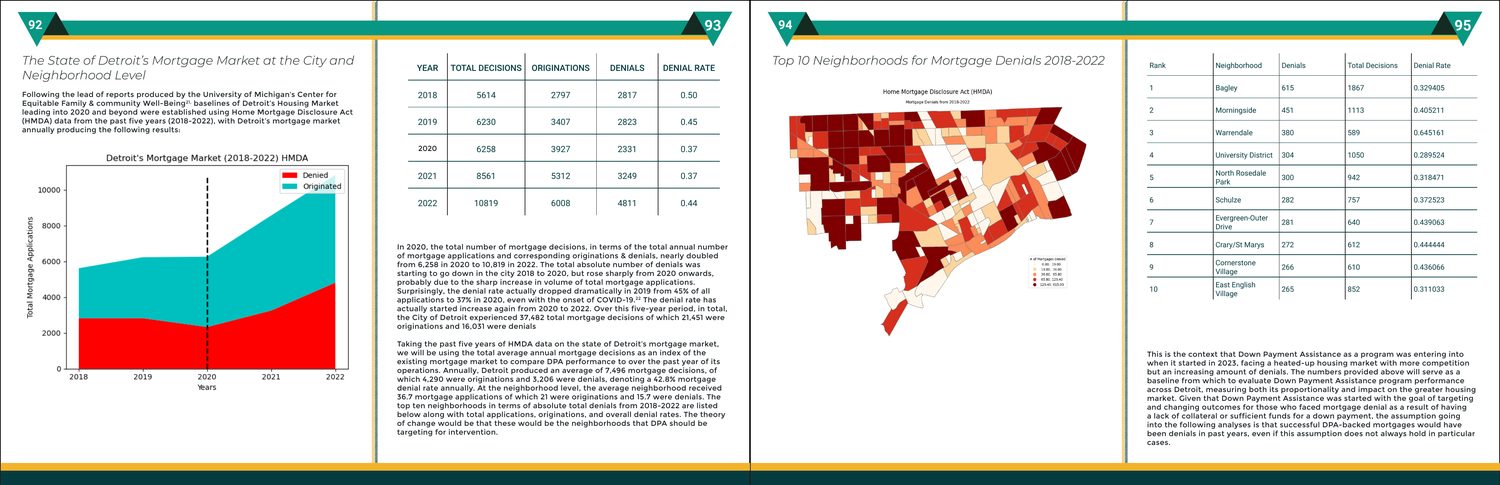
11/12 2024 report, pp. 47 and 48, area chart and choropleth map.
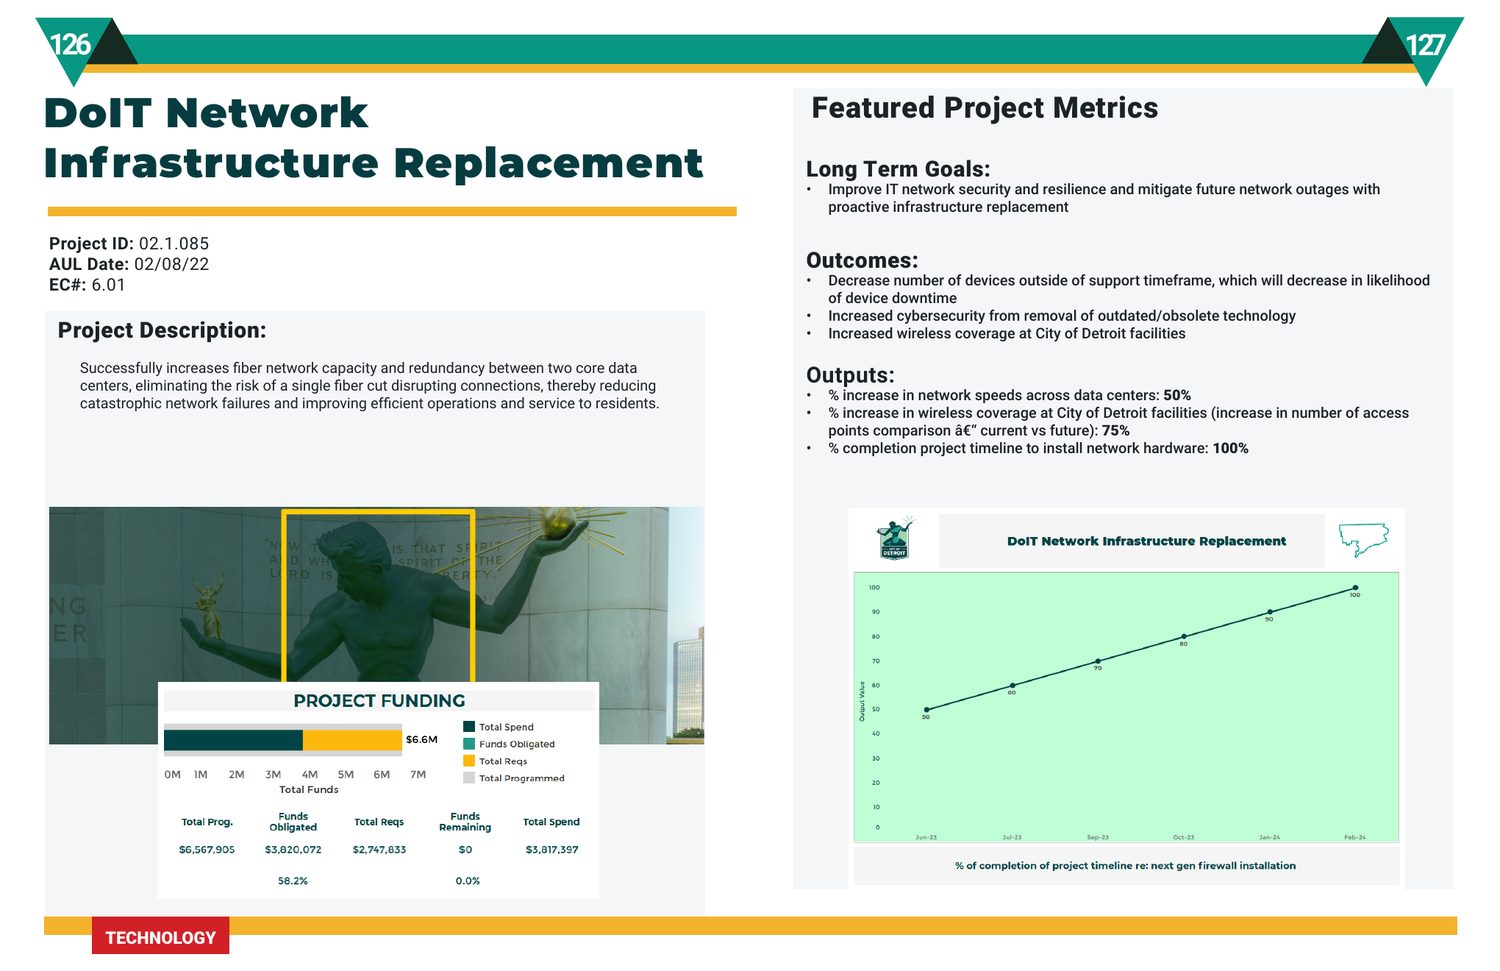
12/12 2024 report, p. 64, project profile (DoIT Network Infrastructure).